Key messages
- Drought is driving needs. Drought and extreme weather are starting to drive humanitarian needs across many parts of Asia and the Pacific, with millions facing increasing food and water insecurity from drought. Preparedness, response and financing should therefore be sequenced ahead of and against national and subnational impact windows.
- Highest immediate concern: for the next two months, Myanmar, the Philippines, Timor-Leste, Papua New Guinea and Tonga, considering both El Niño and price shocks.
- Impacts will unfold in three waves over the next six months. Forecast confidence decreases with each wave, particularly for impacts further into 2027.
- 190 million children are exposed to unusually dry or wet conditions, with heightened risks to food and water security, nutrition, health, education and protection.
Explore by country
Climate risk
{{legendTitle}}
Asia and the Pacific
190M
Children exposed to unusually dry or wet conditions
Asia and the Pacific
91M+
Girls exposed to drier or wetter-than-normal conditions
Papua New Guinea
5.5M+
People exposed or at risk of drought
Philippines
4.6M
Farmers and fisherfolk who could be affected by drought
Timor-Leste
500K+
People in IPC Phase 3+ under the WFP drought scenario
The snapshot is structured in five parts and covers the period from November 2026 into early 2027.
Climate Risk, by Wave
Impacts are expected to unfold in three waves as El Niño peaks, persists and then decays. The maps show where each wave is most likely to bite; the bars below show the seasons each wave overlaps across the region.
See the waves in detailMaps, country outlooks and impacts
Wave 1
Nov 2026
Dec
Wave 2
Jan 2027
Feb
Wave 3 PROVISIONAL
Mar
Apr →
Rainfall deficits
Philippines, eastern Indonesia, Timor-Leste, Papua New Guinea, Solomon Islands
Wetter than average
Afghanistan, Pakistan, Sri Lanka, Kiribati, Naoero and parts of Tuvalu
Dry signal deepens
Mainland South-East Asia and the Philippines
Wetter than average
Northern Papua New Guinea, Solomon Islands, Kiribati, Naoero and Tuvalu
As El Niño decays
Snowmelt in Afghanistan and Pakistan; pre-monsoon heat in mainland South-East Asia
El Niño phase
Approaching peak · peak Dec
Persisting
Potential decay
Forecast confidence
Strongest
Jan strong · Feb weaker
Weak · Apr not covered
 Pacific
Southwest Pacific wet and cyclone season
 Mainland
South-East Asia
Into dry season
Peak dry season
Late dry, pre-monsoon heat
 Timor-Leste,
Indonesia
Main wet and planting season
 Afghanistan,
Pakistan
Winter rainfall and snowfall · wheat season
Snowmelt
 Sri Lanka
Northeast monsoon · maha season
First inter-monsoon
Historical Sea Surface Temperature
Niño 3.4 sea surface temperature: 2026 against every El Niño since 1982
Sea surface temperature now: how the Pacific warmed as El Niño grew
Seasonal outlook
ENSO phase and forecast milestones
The ENSO signal
NOAA ENSO probabilities, 12 November 2026 issue: El Niño 100% through January–March 2027, 98% for February–April and 80% for March–May; ENSO-neutral becomes most likely from April–June (61%), with La Niña chances rising to 33% by June–August.
Chance of a very strong El Niño, by three-month season
12 Nov 2026 issue8 Oct 2026 issue9 Jul 2026 issue14 May 2026 issue
Strength category outlook, November 2026 issue
Moderate La Niña: −1.5 °C < index ≤ −1.0 °CWeak La Niña: −1.0 °C < index ≤ −0.5 °CNeutral: −0.5 °C < index < 0.5 °CWeak El Niño: 0.5 °C ≤ index < 1.0 °CModerate El Niño: 1.0 °C ≤ index < 1.5 °CStrong El Niño: 1.5 °C ≤ index < 2.0 °CVery strong El Niño: index ≥ 2.0 °C
Cyclones
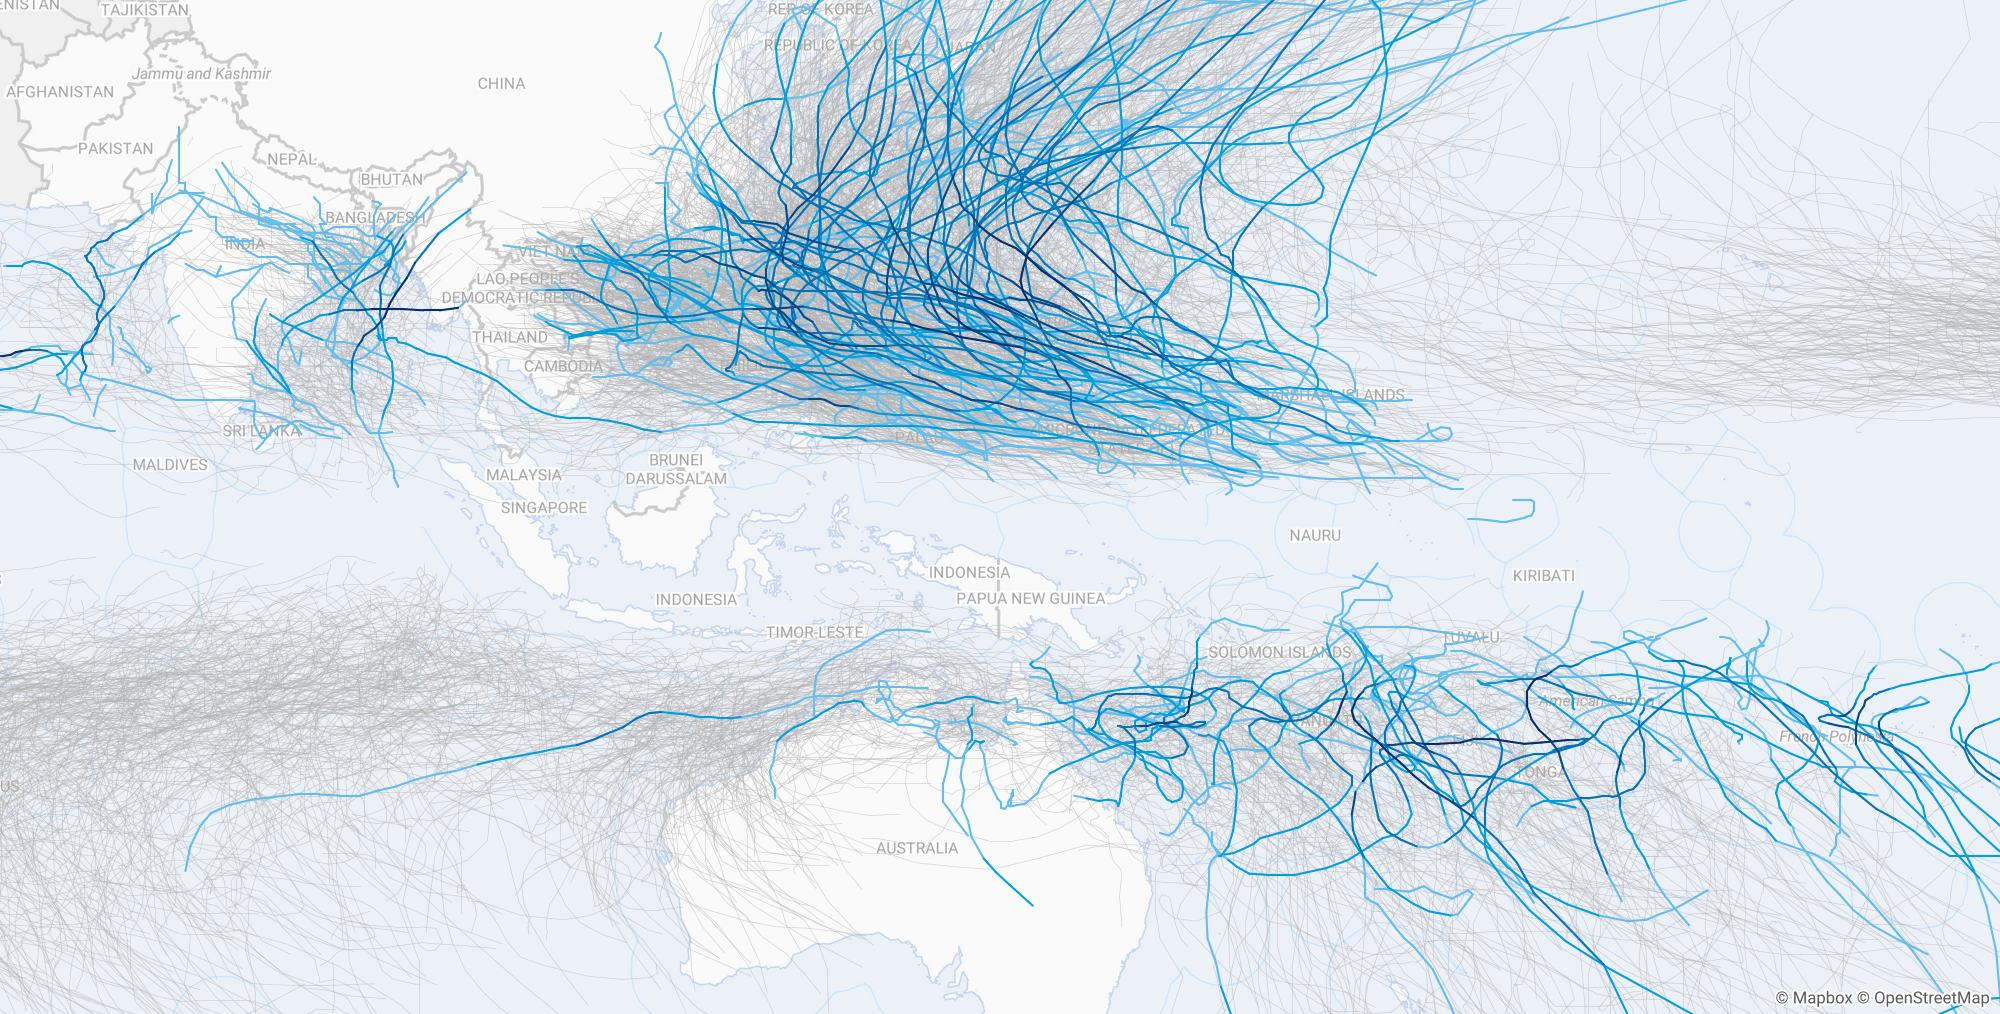
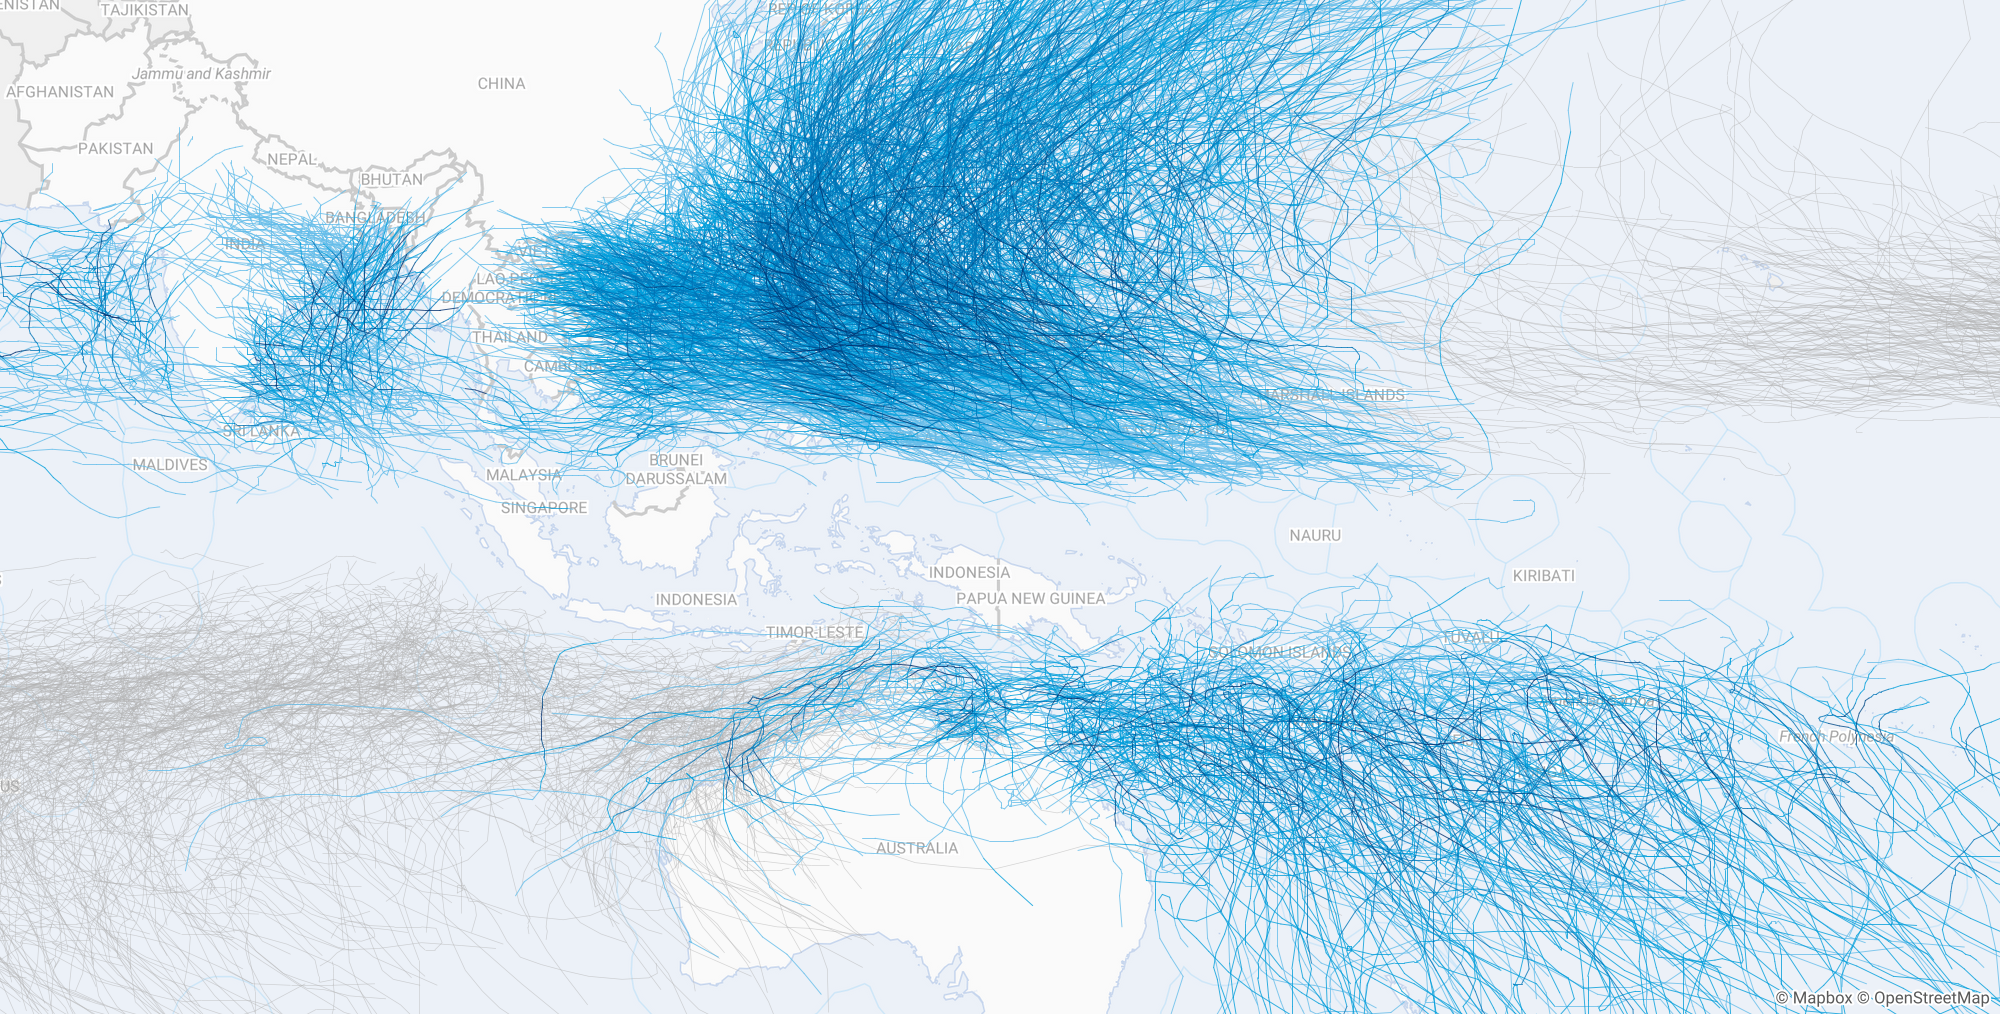
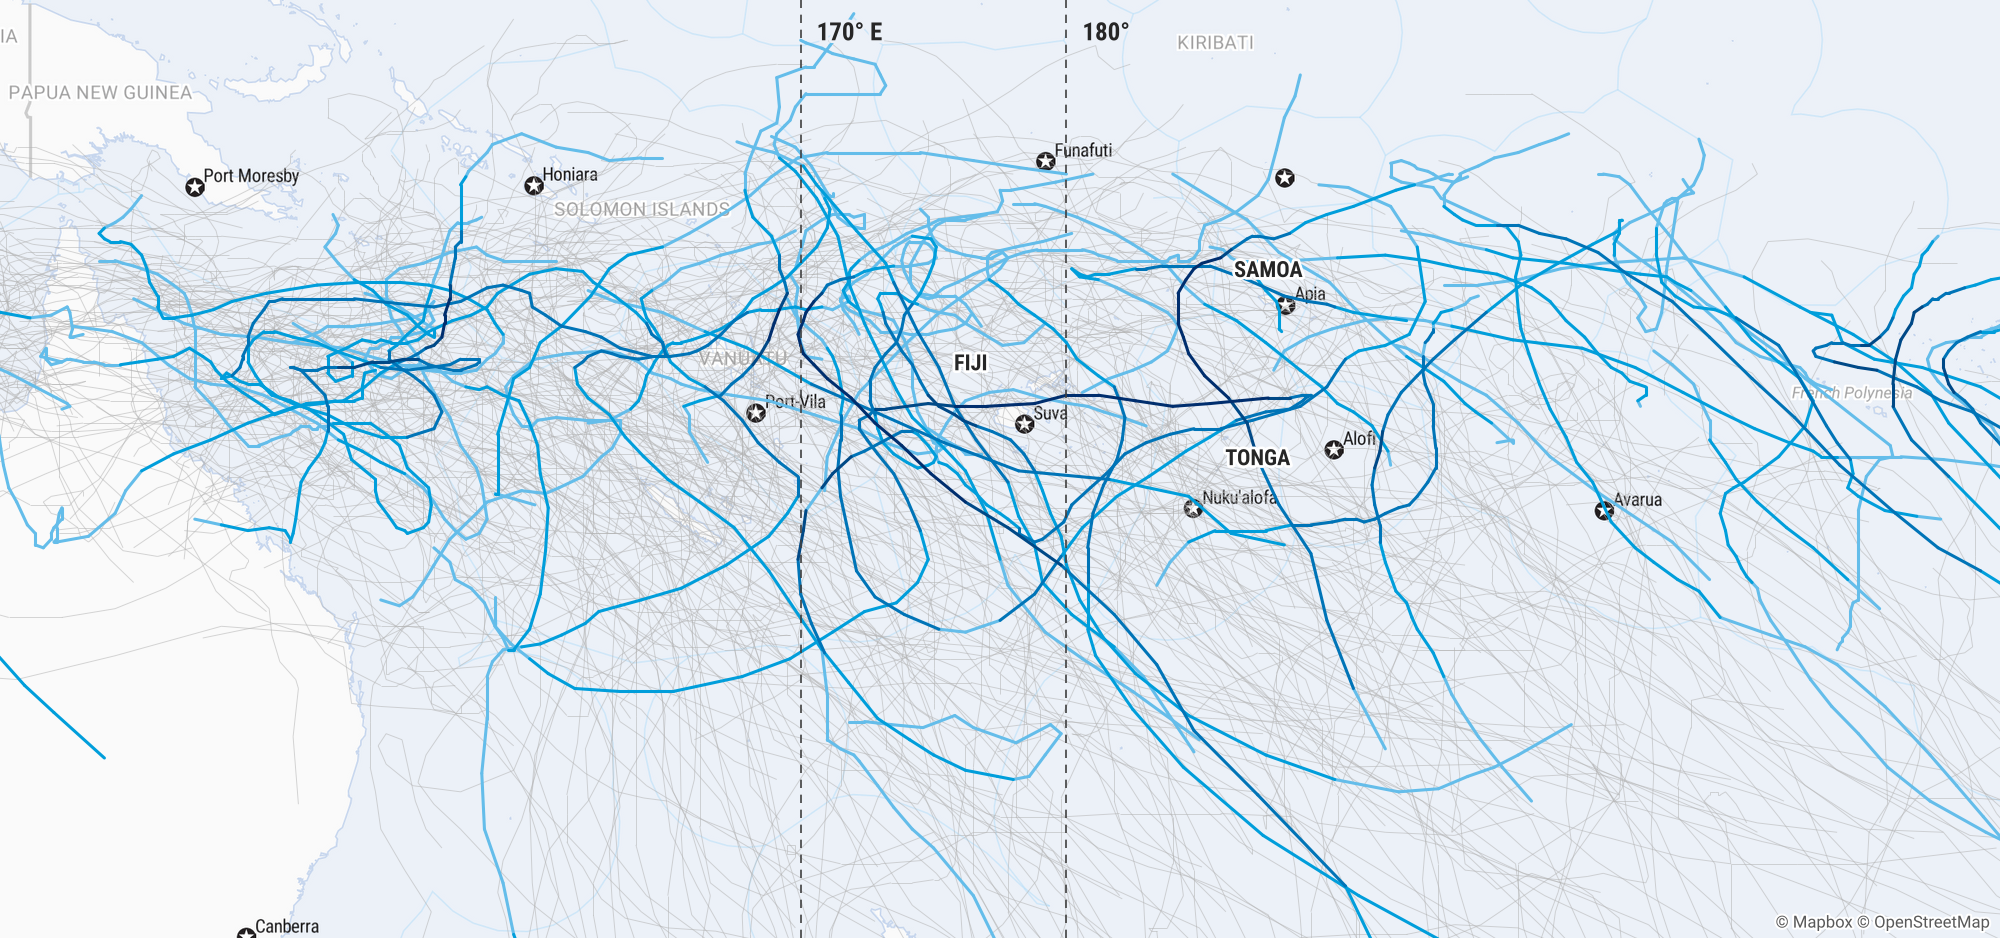
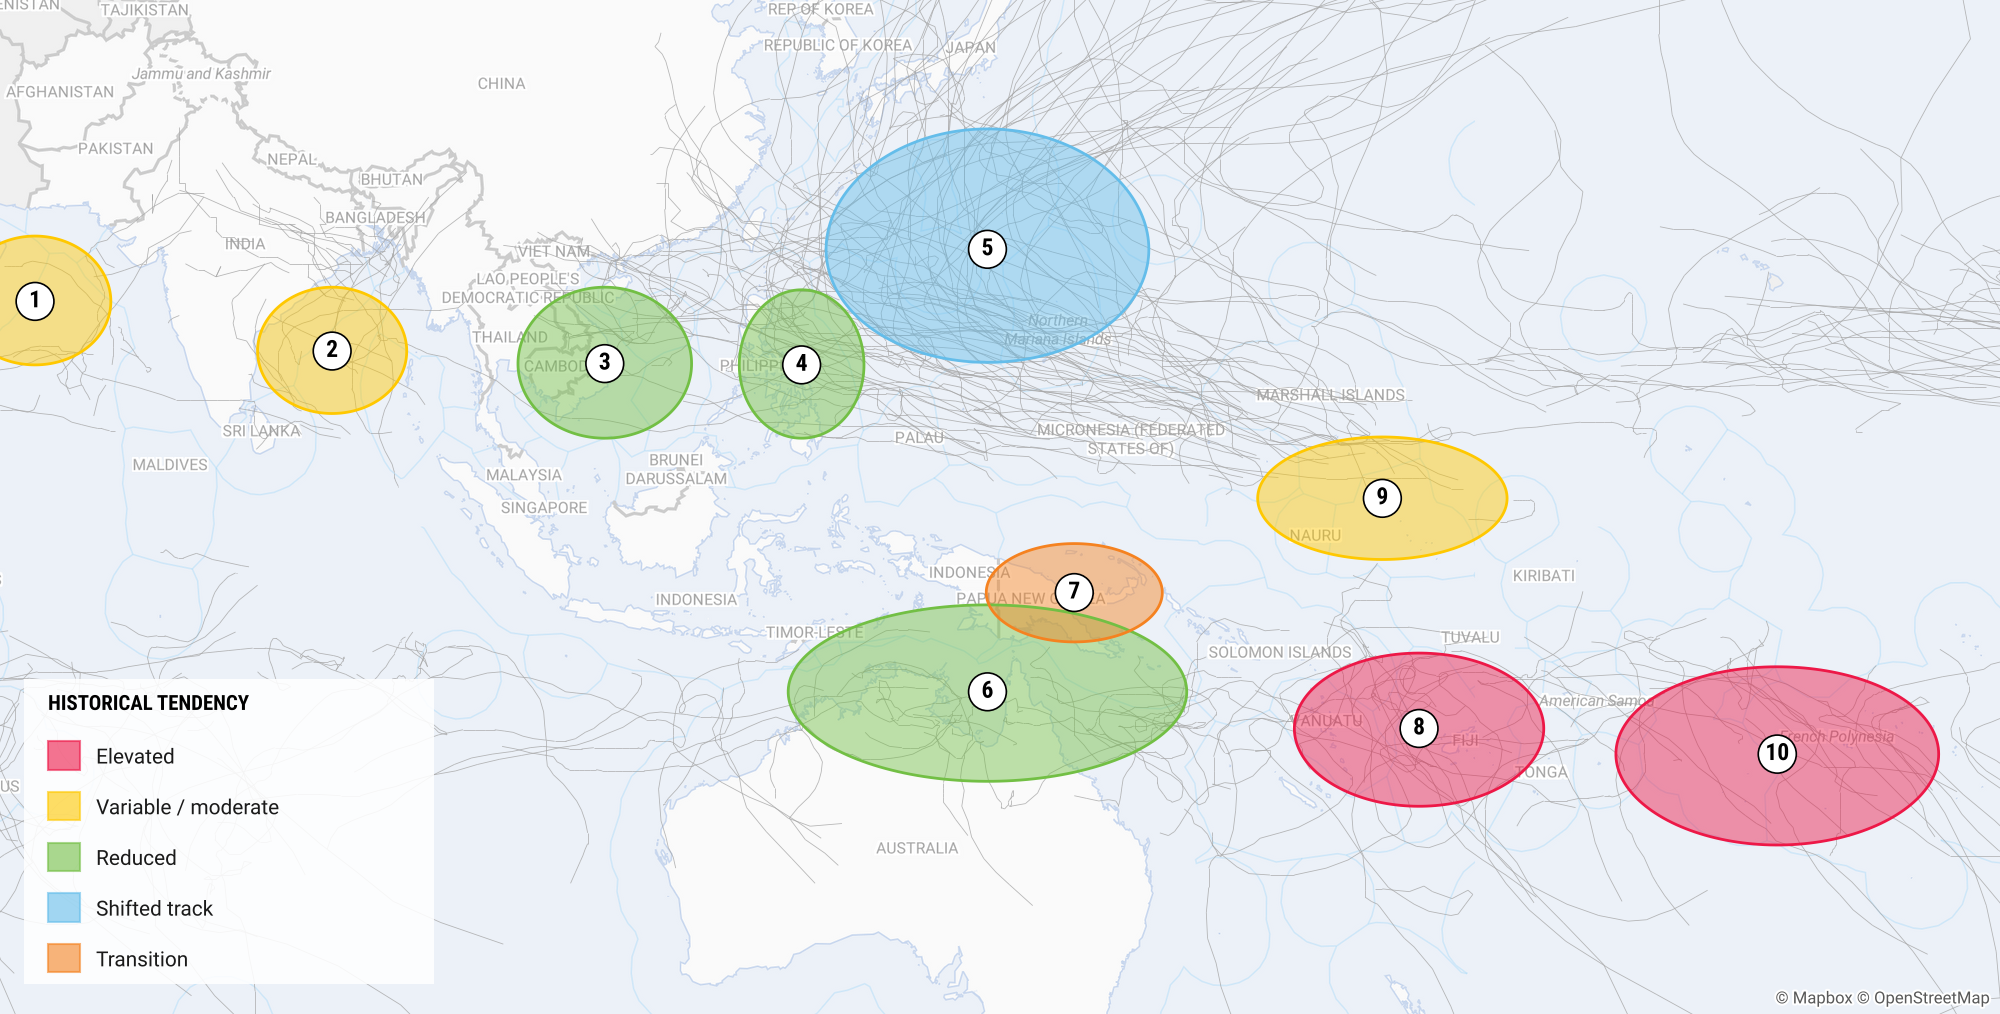
Track colour · top sustained windOther tracksTropical depression · under 34 ktTropical storm · 34–63 ktCategory 1–2 · 64–95 ktCategory 3 · 96–112 ktCategory 4–5 · 113 kt +
NW Pacific storms per season
Average season28
El Niño seasons23
NW Pacific storms ≥ 100 kt
Average season3.5
El Niño seasons5.8
South Pacific storms per season
Average season10
El Niño-peak seasons13
Storms crossing the Philippines
La Niña seasons~11
El Niño seasons8
Fuel prices
Change since 23 February, week of 9 Nov 2026
CountryGasolineDiesel
+59%+87%
+84%+84%
+40%+79%
+45%+78%
+68%+71%
+37%+70%
+44%+68%
+72%+65%
+46%+56%
+12%+55%
+37%+51%
+18%+43%
+27%+41%
+18%+35%
+38%+35%
+31%+35%
+28%+30%
+10%+16%
+10%+12%
+7%+8%
Gasoline against diesel, by country
Week by week, the 12 largest diesel rises
GasolineDieselData not available, 17 Aug 2026 to 19 Oct 2026
Gasoline
MayAug
Nov
Diesel
MayAug
Nov
Indonesia
+59%
+87%
Myanmar
+84%
+84%
Lao PDR
+40%
+79%
Fiji
+45%
+78%
Malaysia
+68%
+71%
New Zealand
+37%
+70%
Gasoline
MayAug
Nov
Diesel
MayAug
Nov
Sri Lanka
+44%
+68%
Philippines
+72%
+65%
Australia
+46%
+56%
Viet Nam
+12%
+55%
Cambodia
+37%
+51%
Singapore
+18%
+43%
Source: GlobalPetrolPrices.com, retail pump prices, change since 23 February 2026, weekly to 9 Nov 2026.